By Cathy Dew
In case you missed it, here are the first four blogs in our series on business process analysis templates:
This week we look at process flow diagrams…
Why Process Flow Diagrams work so well
Process flow diagrams are a common tool among a set of tools that assist in documenting and establishing consensus for a process. A process flow diagram, or flowchart, is essentially a visual representation of a process showing how things work from start to finish. Generally speaking, they read from top to bottom and left to right. Common shapes like boxes, rectangles and diamonds are used to depict the process, all inputs, all outputs and decision points along the way. Arrows are included to show the sequential flow of the business process.
Here's an explanation of a basic flow and definition of shapes from Microsoft. And of course, Wikipedia is a great resource.
Multiple participants are depicted on a flowchart and it’s important to note that participants can include both people and systems. For complex business processes, individual systems may be called out due to their importance, however, for simpler processes, all systems can be grouped together.
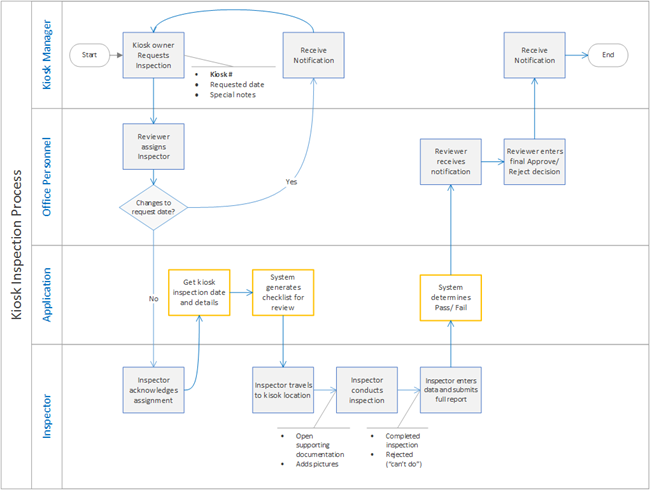
A "cross-functional" flowchart is one that is divided into different swim lanes, or rows, which show the responsibility of each participant for different parts of a single process. Swim lanes divide the chart with parallel lines and label one lane for each participant or role. They are a mechanism for organizing activities to visually illustrate different roles and responsibilities. Swim lanes are helpful when the business process is complicated with lots of participants and systems to take into account. Pay special attention to points in the process where lines cross from one lane to another, or from one participant to another. These can be points where process refinement might be possible. For simpler processes, swim lanes may not be necessary.
Why Use Process Flow Diagrams?
The primary function for process flow diagrams is to understand and illustrate every single step in a process. Commonly managers believe processes work one way only to find out from the people doing the work that processes work a different way entirely.
Process flow diagrams bring everyone to the same page with the whole picture so that everyone can understand more than just their part of the overall process. This is where the tool gets powerful as a change agent. When you are ready to review the process flow, generate a large format print-out of the flowchart and spread it out on a table. Meet with everyone involved in the process to validate all the steps and identify any duplication of effort. This is often when "aha" moments happen – I didn't know you did that! Oh, that's what happens next.
Once this process is documented for today, we can brainstorm on ways to streamline and improve the process tomorrow. This exercise is known as the As Is/To Be and it is a natural extension of the process flow diagram for projects that need it.
For reference please click here to download a sample process flow diagram (request for a kiosk inspection).
What are some benefits of process flow diagrams?
Flowcharts are a powerful because of two critical factors:
- Graphics speak volumes. Generally speaking, people don't (like to) read. Creating a visual illustration of a seemingly boring process flow can be a more interesting way to learn about the process. It also and can clearly illuminate what is happening across people and departments, what is completed on a computer versus offline, basic inputs and outputs in addition to the overall steps involved. Another visual extension we've used is the introduction of color or event outline style to further illustrate additional aspects of the process. For example, whether or not a step is manual or automated.
- Flowcharts build consensus. Through the exercise of understanding a business process with flowcharts, an environment of trust is created among the people most affected by the work. With trust comes credibility and buy-in for the new process or system.
What are some pitfalls of process flow diagrams?
There are a few pitfalls to be aware of when working with process flow diagrams. For one thing, the format is large and often unwieldy. The large format print-out works for an in-person meeting but fails spectacularly as an email attachment and this logistical issue is difficult to work around. Another consideration is the challenge of getting a large group of stakeholders together for this exercise. While it can be a very powerful forum to build consensus and buy-in, if poorly managed, this can devolve into a free-for-all.
Another potential pitfall of process flow diagram is an inappropriate level of detail. Knowing what level of detail to include on any flowchart is really determined by the skill of the business analyst on the project. Glossing over important things can lead to partial results. Similarly, too much detail makes the flowchart unreadable and cumbersome. Finding the sweet spot in the level of detail comes with experience and practice until an intuition develops.
One final note on flowchart pitfalls is the validity of the data itself. During the interview process building up to the creation of the flowchart, it is critical to gain the trust of the participants so that they are forthcoming with information. Without the right environment of trust and openness, incomplete information is a real and present danger.
Conclusion
Today, we covered process flow diagrams and how they can be used to document and visually illustrate a business process. However, this is only one tool among a group of tools used in business process analysis work. In upcoming blogs, we will breakdown other tools like IPOs and data flow diagrams.
If you need help navigating this process, feel free to reach out to 2Plus2! We are always happy to help improve your business process flows. Call us at (510) 652-7700.